Trending topics on Twitter have become a common source of news articles in recent years. In this article, we will walk through how to use a Twitter API with Python. The data will be downloaded to populate a database. The database will be queried to generate data for a trend chart of popular topics over the last 10 days.
We are going to follow this process:
A Five-Step Process
- Get an API Key
- Subscribe to the Twitter API
- Use Twitter API with Python to populate a database
- Export the popular topics over time into a Comma Separated Values file
- Use the data to generate a trend chart in Excel
Step 1. Get an API Key
First, we need to get a free API Key. The Twitter Trending Topics Archive API is the API we will use. We will use it to capture the trend data of popular hashtags. RapidAPI hosts the API so the first step is to get a RapidAPI API Key if you don’t have one already. That is a quick process, you get a Key after you register at RapidAPI.com.
Step 2. Subscribe to the Twitter API
There are several Twitter APIs on RapidAPI. I chose the Twitter Trending Topics Archive API for two main reasons. It is very simple to use and provides reliable data that can be used to generate trends over time. On the endpoints page, there is a blue button in the middle called “Subscribe to Test”. Once you click that you can choose the free option to start with. Then you can enter a date, select a country, and click the Test Endpoint button to make an API call. The result is a link that can be used to download the popular tags. The data in the file is from the country requested and broken down by hour.
Step 3. Use Twitter API with Python to populate a database
Using the link retrieved from the API, we can download a CSV file with a day’s worth of data. For this article, I left the default country set to the US and set the date to be the previous day. The previous day is the default if you don’t select anything.
The usage model for this is a daily scheduled task, which is fine since each download provides 24 hours of data. Below is the full Python code to make an API call, download the CSV file, and import the data into a local MySQL database:
#! python
"""
File: twitterTrendCapture.py
Description:
  This script uses an api to get a download for trending twitter hashtags,
    then adds the data to a local database.  It can be run as a cron job or scheduled task daily.
"""

#import libraries used below
import http.client
import mysql.connector
from mysql.connector import errorcode
import pandas as pd
import json
from datetime import date
from datetime import timedelta
import requests

#Setup api details here
api_conn = http.client.HTTPSConnection("onurmatik-twitter-trends-archive-v1.p.rapidapi.com")
headers = {
    'x-rapidapi-host': "onurmatik-twitter-trends-archive-v1.p.rapidapi.com",
    'x-rapidapi-key': "8ea6d22264mshd97d2ff15c516c5p160f30jsn8a63f7d83682"
    }

#Define function to get json response from rapidapi
def get_api_response(captureDate):
    api_conn.request("GET", "/download?date="+str(captureDate)+"&country=US", headers=headers)
    res = api_conn.getresponse()
    data = res.read().decode("utf-8")
    thejson = json.loads(data)
    return thejson

#Connect to the local database
try:
    cnx = mysql.connector.connect(user='root', password='',
                              host='localhost',
                              database='rapidapi_examples')
except mysql.connector.Error as err:
    if err.errno == errorcode.ER_ACCESS_DENIED_ERROR:
        print("Something is wrong with your user name or password")
    elif err.errno == errorcode.ER_BAD_DB_ERROR:
        print("Database does not exist")
    else:
        print(err)

# Get date to be used in the API call
today = date.today()
daysBack = 1 #set to 1 to get a full set of yesterday's data
captureDate = today - timedelta(days = daysBack)

#Make the API call and return the response to get a link
api_response = get_api_response(captureDate)
resultsURL = api_response['url']

#Download the file specified by the URL returned by the API into a pandas dataframe object
df = pd.read_csv(resultsURL)

#Loop through the data from the CSV file
for index, row in df.iterrows():
  #Remove quotes and hashtag symbols from hashtags, and single quotes from other fields
  thisHashTag = row[0].replace("'",'').replace('"','').replace('#','')
  thisLoc = row[1].replace("'",'')
  thisLocType = row[2].replace("'",'')
  thisTime = row[4].replace("'",'')
  thisCount = row[5] #This field is sparsely populated so we will ignore it
  thisDate = row[3]
  thisDT = row[3]+" "+thisTime+":00"

  #add record to database
  sql = ("insert into twitter_popular_tags (hashtag,location,location_type,popular_date_time,popular_date)"
      " values ('"+thisHashTag+"','"+thisLoc+"','"+thisLocType+"','"+thisDT+"','"+thisDate+"')")
  cursor = cnx.cursor()
  try:
    cursor.execute(sql)
    cnx.commit()
  except mysql.connector.DataError as e:
    print("DataError from query: "+sql)
    print(e)
  except mysql.connector.InternalError as e:
    print("InternalError from query: "+sql)
    print(e)
  except mysql.connector.IntegrityError as e:
    print("IntegrityError from query: "+sql)
    print(e)
  except mysql.connector.OperationalError as e:
    print("OperationalError from query: "+sql)
    print(e)
  except mysql.connector.NotSupportedError as e:
    print("NotSupportedError from query: "+sql)
    print(e)
  except mysql.connector.ProgrammingError as e:
    print("ProgrammingError from query: "+sql)
    print(e)
  except :
    print("Unknown error occurred from query: "+sql)
To hold the data captured over several days we can use a table like this in MySQL. This structure matches the queries above in the Python code:
CREATE TABLE `twitter_popular_tags` (
  `twitter_popular_tags_id` int(11) NOT NULL,
  `hashtag` varchar(255) DEFAULT NULL,
  `location` varchar(255) DEFAULT NULL,
  `location_type` varchar(255) DEFAULT NULL,
  `popular_date_time` datetime DEFAULT NULL,
  `popular_date` date DEFAULT NULL
) ENGINE=InnoDB DEFAULT CHARSET=latin1;


ALTER TABLE `twitter_popular_tags`
  ADD PRIMARY KEY (`twitter_popular_tags_id`),
  ADD KEY `hashtag` (`hashtag`),
  ADD KEY `popular_date_time` (`popular_date_time`),
  ADD KEY `popular date` (`popular_date`);


ALTER TABLE `twitter_popular_tags`
  MODIFY `twitter_popular_tags_id` int(11) NOT NULL AUTO_INCREMENT;
Step 4. Export the popular topics over time into a Comma Separated Values file
Once we collect the data into a database table and index it (see keys above), we can export data summaries. Within the data from the default country the US there are 64 possible locations listed. These locations refer to major cities.
There are records for each hour, so you could see Twitter trends by the hour and/or by location. You can pull this data within one country or between different countries. I first tried to break it down by hour for all locations. I found many hashtags that appeared in every location for a given hour. A chart showing over a hundred data points at the same value would not be meaningful. Then I pulled summaries by day and got lots of variations.
First I pulled a list of Twitter hashtags which were the most popular over 10 days. I used this query for that: select hashtag,count(*) freq from `twitter_popular_tags` group by hashtag ORDER BY `freq` DESC limit 10;
Once I had that list, I put it into a subquery. I used the subquery to get frequencies of those hashtags by day like this:
select hashtag,popular_date,count(*) freq
from `twitter_popular_tags`
where hashtag in (
  select hashtag from (select hashtag,count(*) freq from `twitter_popular_tags` group by hashtag ORDER BY `freq` DESC limit 10) tmp
)
group by hashtag,popular_date
order by hashtag
Step 5. Use the data to generate a trend chart in Excel
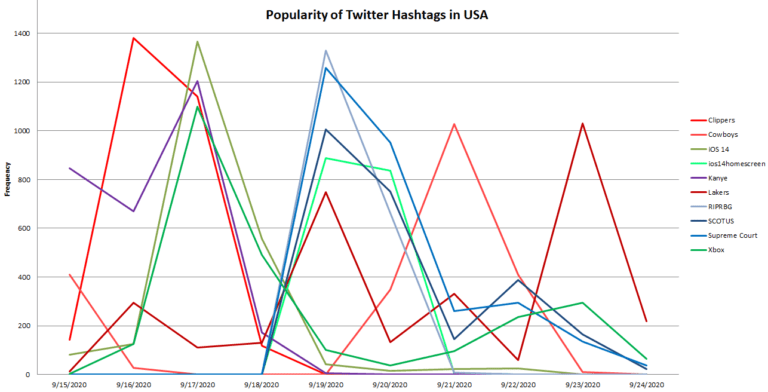
The query above resulted in 61 records, but I had to split them by hashtag and line up the dates. Excel requires this to put them all on the same chart (shown below). I came up with 3 categories and one oddball Twitter topic among the top 10 most popular for September 15th to 24th. I made the sports hashtags a shade of red, political topics blue, and technology green. Kanye is the purple oddball because it is difficult to fit him in one category.

What can we learn from this trend chart? I did a bit of research to understand what happened on the dates when different topics spiked:
- September 15th was a Clippers/Nuggets game. Clippers spiked the next day to almost 1400 but Nuggets only hit 140 and did not make the top 10 list so it’s not on the chart.
- On September 17th Apple released iOS 14. That is also the day Virginia denied Kanye from the presidential ballot. Xbox announced a new version of its player coming out.
- September 19th the Supreme Court published a press release. It was about the passing of Justice Ruth Bader Ginsburg. (RIPRBG = Rest In Peace Ruth Bader Ginsburg, SCOTUS = Supreme Court Of The United States)
- September 20th was a Cowboys/Falcons game at 2 pm on a Sunday. Cowboys spiked on Twitter the next day when people went back to work and tweeted about the game. Falcons did too but not enough to make the top 10 hashtags between Sept 15th and 24th.
- The Lakers had games on September 18th, 20th, and 22nd against the Nuggets. The Lakers tag spiked on the 19th and the 23rd but not much on the 21st. So either the game on the 20th wasn’t exciting or people watched the Cowboys game instead. And again the Nuggets were not popular after any of those games.
Conclusion
In this article worked through how to use a Twitter API with Python. Specifically, the Twitter Trending Topics Archive API which provides a wealth of data for download. We can mine this data for interesting information. For example, it is clear that more people follow the Clippers, Lakers, and Cowboys than the Falcons or Nuggets. Also, the period of time people keep tweeting about events seem to be different depending on the topic. Tweets about the passing of a Supreme Court Judge were popular over several days, but sports games tailed off rather quickly.
There are many possible applications of this data for localized marketing efforts around the world. It’s enlightening to find out which topics people engage with compared to what is announced in the news.
Leave a Reply